Independent samples t-test with XLStat
Table of content
What is an independent sample t-test?
The independent samples t-test assesses the difference between the means of two independent or unrelated groups. More specifically, the test evaluates whether the means for two independent groups are significantly different from each other.
The independent samples t-test is also referred to as a between-groups design. With an independent-samples t-test, each case must have scores on two variables :
- The independent variable: This variable divides cases into two mutually exclusive groups or categories, such as male or female for the grouping variable gender. In a database, the variable is coded 0 or 1. For instance, 0 = Male and 1 = Female. This variable is qualitative and is composed of two modalities (also called a binary variable).
- The dependent variable: This variable describes each participant's answers on some quantitative dimension, such as brand loyalty (e.g., measured with a Likert scale). The variable is quantitative (also called a continuous variable).
The t-test evaluates whether the mean value of the brand loyalty variable for one group (e.g., male) differs significantly from the mean value of the brand loyalty variable for the second group (e.g., female).
Description of the dataset
Feel free to download the dataset to learn how to conduct an independent sample t-test with XLStat. The data are fictitious. In the database, there are 4 variables: Brand heritage, Perceived heritage, Brand quality, and Brand loyalty.
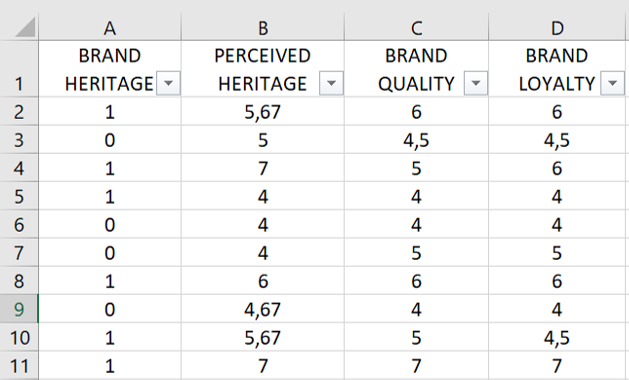
In this experimental study, participants were randomly exposed to a brand that had some heritage or not. A brand with heritage use symbols from the past. In the database, brand heritage coded as "0" means that the participants were exposed to the brand without heritage (i.e., the control condition) and brand heritage coded as "1" means that the participants were exposed to the brand with heritage.
Then, the questionnaire assessed brand quality and brand loyalty.
Finally, perceived heritage was measured and serves as a manipulation check (e.g., I would say that the brand is a brand with a great tradition).

Brand without heritage
(control condition)
Coded "0" in the database

Brand with heritage
(experimental manipulation)
Coded "1" in the database
Setting up a independent samples t-test
After opening XLSTAT, select the XLSTAT / Parametric tests / Two-sample t and z-test command, or click on the corresponding button of the Parametric tests toolbar (see illustration below).
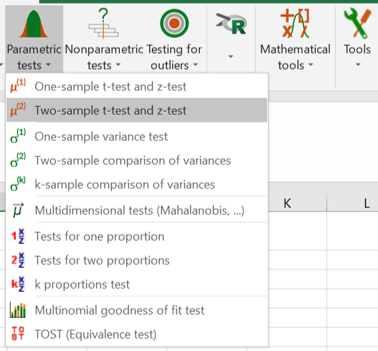
Once you have clicked on the button, the dialog box "Two-sample t-test and z-test" appears.
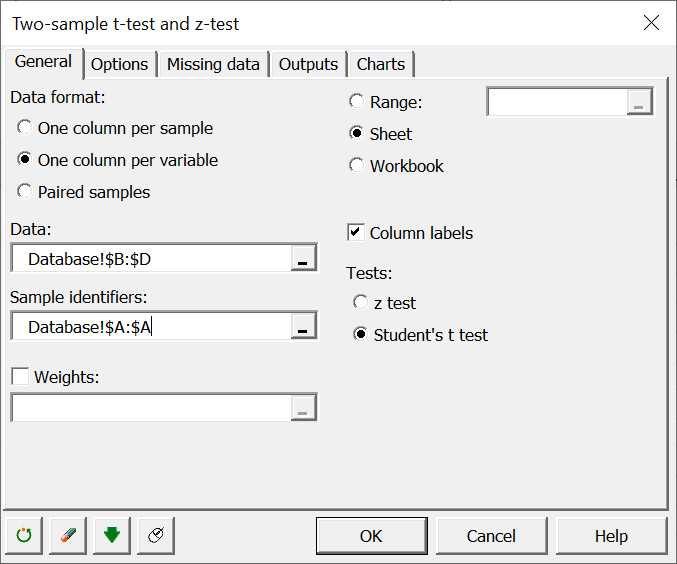
Select "One column per variable" because the dataset format is such that you have one variable per column.
- In Data select the column of the dependent variables you want to analyze. For this exercise, select columns B, C, and D. These columns correspond to the Perceived heritage, Brand quality, and Brand loyalty variables.
Note that you can select a range of non-adjacent columns. To do so, you can press the Ctrl key on your keyboard while selecting the data with the mouse.
- In Sample identifiers, select column A corresponding to our independent variable (Brand heritage).
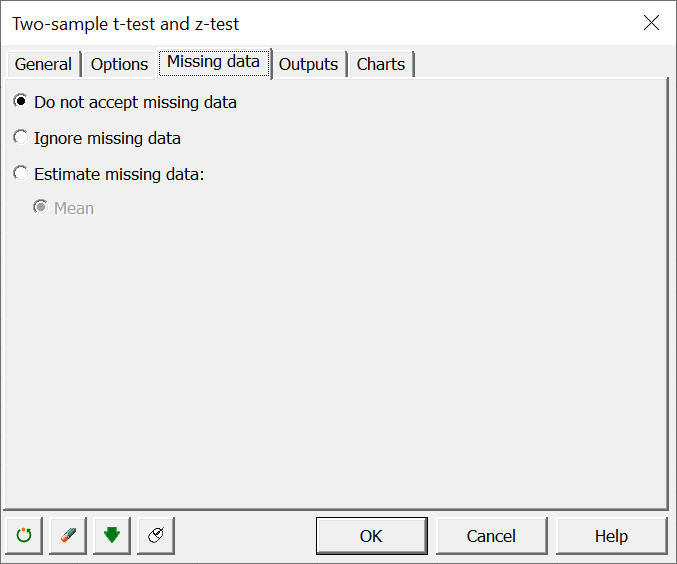
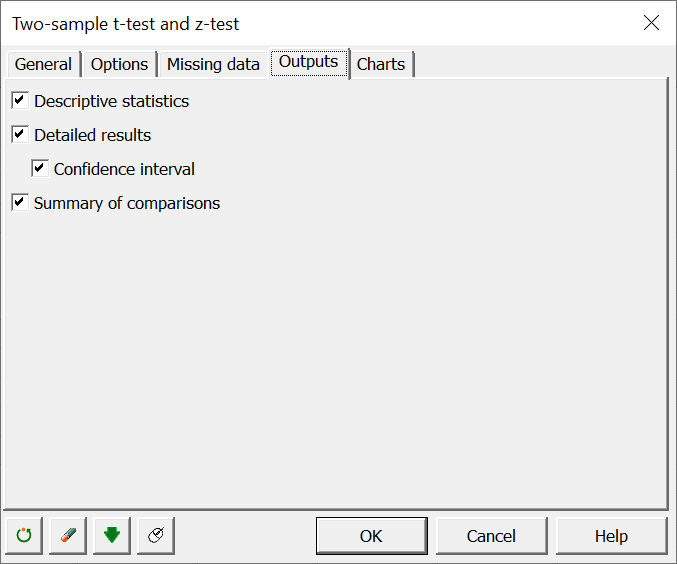
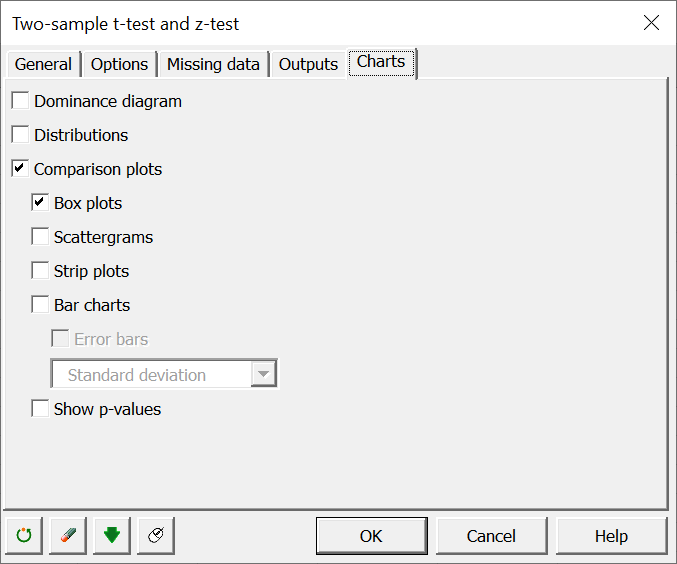
In the other tabs, such as Options, Missing data, Outputs, and Charts, leave the default options. However, make sure that you only select the parameters as it is shown in the illustration below.
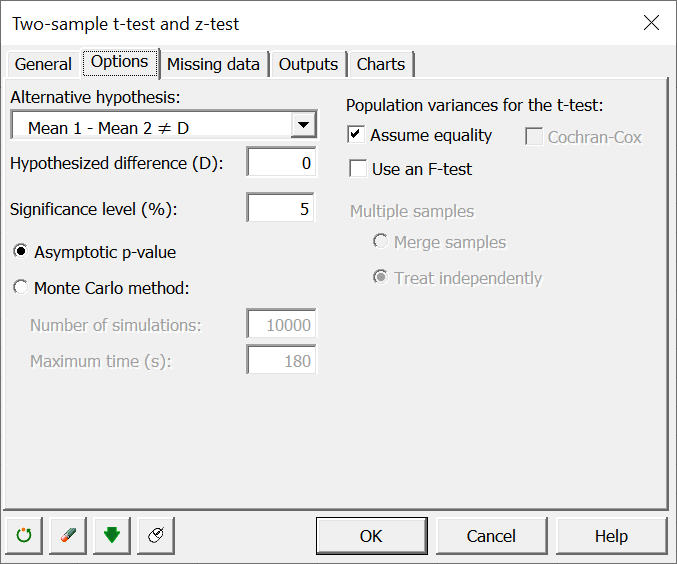
The computations begin once you have clicked on OK. The results will then be displayed on a new sheet.
Interpreting the results of the independent samples t-test
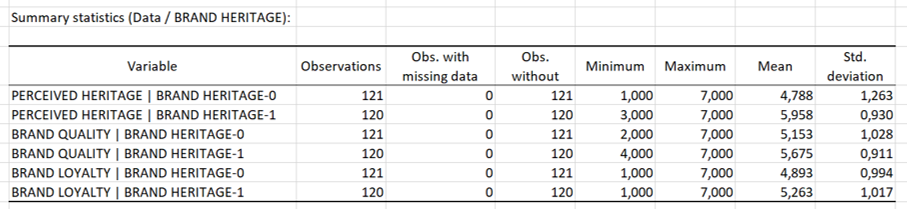
In the table Summary statistics, you can see three interesting insights:
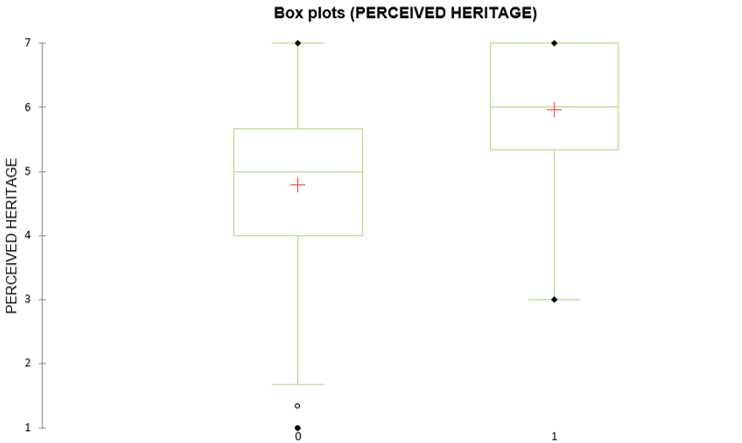
- The mean score of perceived heritage is higher in the brand heritage condition (M = 5.96) than in the brand without heritage condition (M = 4.79).
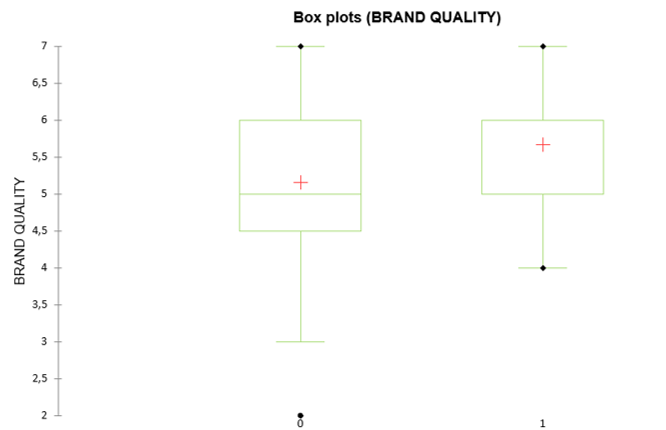
- The mean score of brand quality is higher in the brand heritage condition (M = 5.67) than in the brand without heritage condition (M = 5.15).
- The mean score of brand loyalty is higher in the brand heritage condition (M = 5.26) than in the brand without heritage condition (M = 4.89).
Note that you do not know whether these mean differences are statistically significant or not. If they are not statistically significant, thus it means that means are equal between experimental conditions. In this case, brand heritage does not influence perceived heritage, brand quality, and brand loyalty.
For now, we see that brand heritage seems to positively impact these variables.
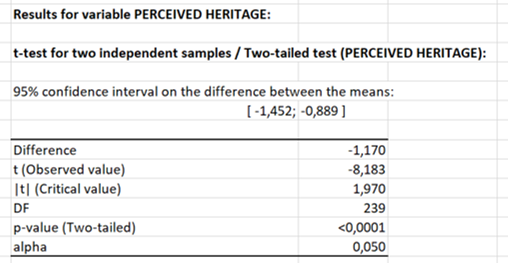
In the table Results for variable PERCEIVED HERITAGE, the p-value is lower than .001. This means that the results of the t-test indicate that the mean difference in perceived heritage (our manipulation check) by experimental conditions is statistically significant (p < .001). Therefore, we can claim that our manipulation is successful.
The Box plot chart illustrates the mean scores of perceived heritage between the two experimental conditions (Brand heritage = 0; Brand heritage = 1). The chart shows that the mean score of perceived heritage is higher when the brand has heritage.
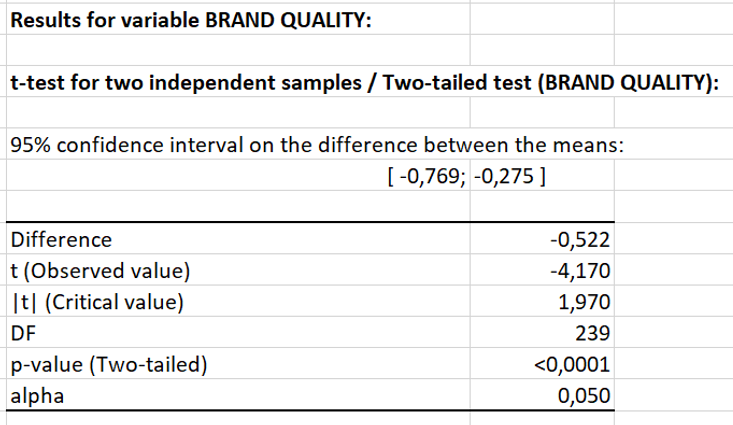
In the table Results for variable BRAND QUALITY, the p-value is lower than .001. This means that the results of the t-test indicate that the mean difference in brand quality by experimental conditions is statistically significant (p < .001). Therefore, we can accept our hypothesis that brand heritage positively influences brand quality.
The Box plot chart illustrates the mean scores of brand quality between the two experimental conditions (Brand heritage = 0; Brand heritage = 1). The chart shows that the mean score of brand quality is higher when the brand has heritage.
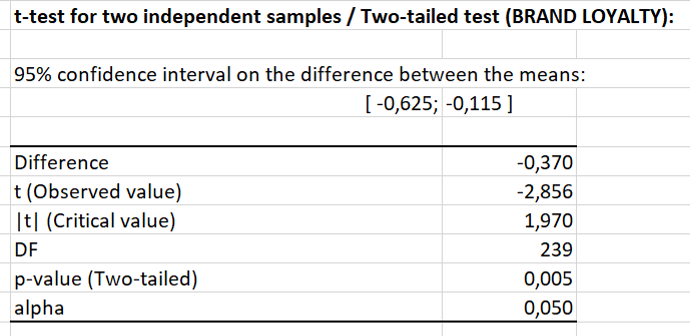
In the table Results for variable BRAND LOYALTY, the p-value is .005, thus lower than .05. This means that the results of the t-test indicate that the mean difference in brand loyalty by experimental conditions is statistically significant (p < .01). Therefore, we can accept our hypothesis that brand heritage positively influences brand loyalty.
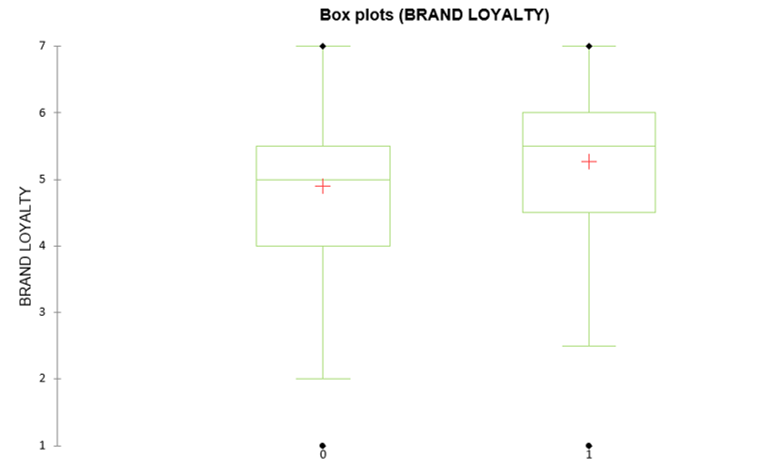
The Box plot chart illustrates the mean scores of brand loyalty between the two experimental conditions (Brand heritage = 0; Brand heritage = 1). The chart shows that the mean score of brand loyalty is higher when the brand has heritage.
Reporting the results of the independent samples t-test
Here are examples of how to report the results in a written form:
- The results of an independent sample t-test showed that participants exposed to the brand heritage condition have a higher mean score on perceived heritage (M = 5.96) than those exposed to the brand without heritage condition (M = 4.79) (p < .001). Therefore, our experimental manipulation is successful.
- The results of an independent sample t-test revealed that the mean score of brand quality is higher in the brand heritage condition (M = 5.67) than in the brand without heritage condition (M = 5.15) (p < .001).
- The results of an independent sample t-test indicated that participants exposed to the brand heritage condition reported higher brand loyalty (M = 5.26) than those exposed to the brand without heritage condition (M = 4.89) (p < .01).