Linear regression with XLStat
Table of content
What is linear regression?
A simple linear regression predicts a variable depending on another variable based on a linear relationship. Simple linear regression is a statistical method that allows us to test the relationship between two continuous quantitative (also called continuous) variables. Suppose you are trying to predict a quantitative variable depending on several other quantitative variables. In that case, this is called multiple linear regression.
Description of the dataset
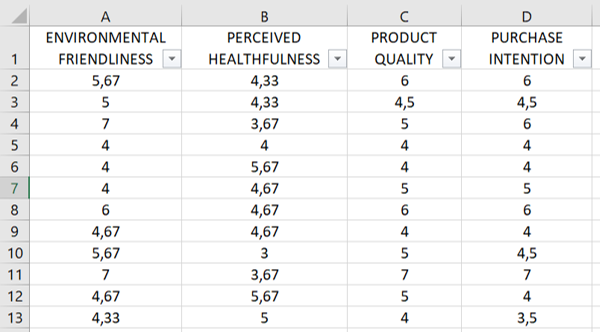
You can download the dataset to learn how to conduct a simple linear regression and a multiple linear regression with XLStat. The data are fictitious. In the database, there are four variables: Environmental friendliness, Perceived healthfulness, Product quality, and Purchase intention. All these variables are quantitative and were measured using Likert scales.
We first want to conduct a multiple linear regression to test if (X1) environmental friendliness and (X2) perceived healthfulness positively influence product quality (Y). Then, we want to conduct a simple linear regression to test if product quality positively (X) influences purchase intention (Y). Therefore, we will first learn how to conduct a multiple linear regression and then run a simple linear regression.
Setting up a multiple linear regression
Open XLStat and Modeling data > Linear Regression
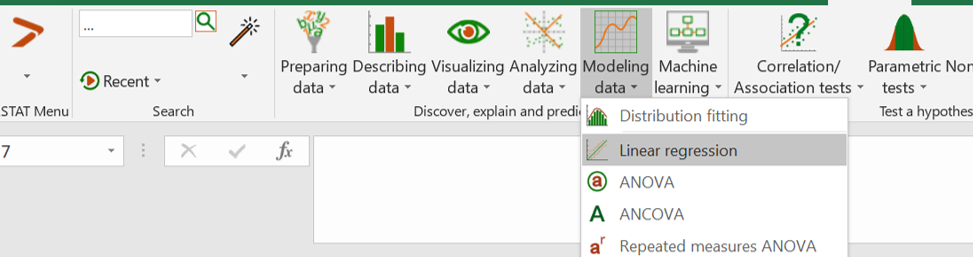
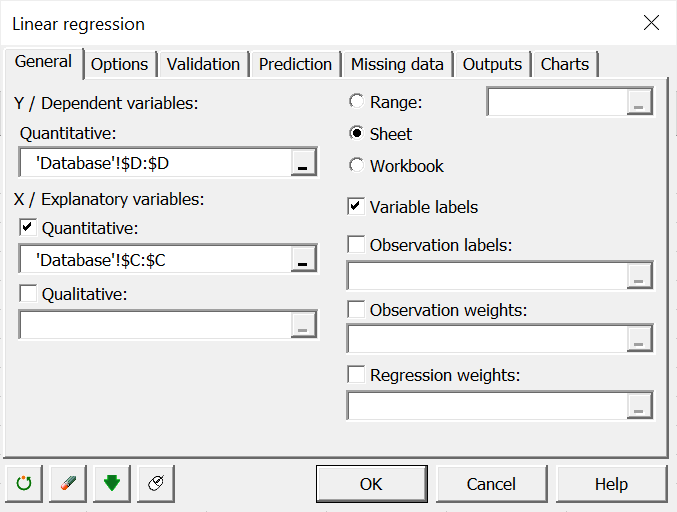
Once you have clicked on the button, the dialog box "Linear regression" appears.
Select the data on the Excel sheet.
- The dependent variable (Y) is the Product quality (column C).
- The independent variables (X) are Environmental friendliness and Perceived healthfulness (columns A and B).
Note that you can select a range of non-adjacent columns. To do so, you can press the Ctrl key on your keyboard while selecting the data with the mouse.
Since the column title for the variables is already selected, leave the Variable labels option activated.

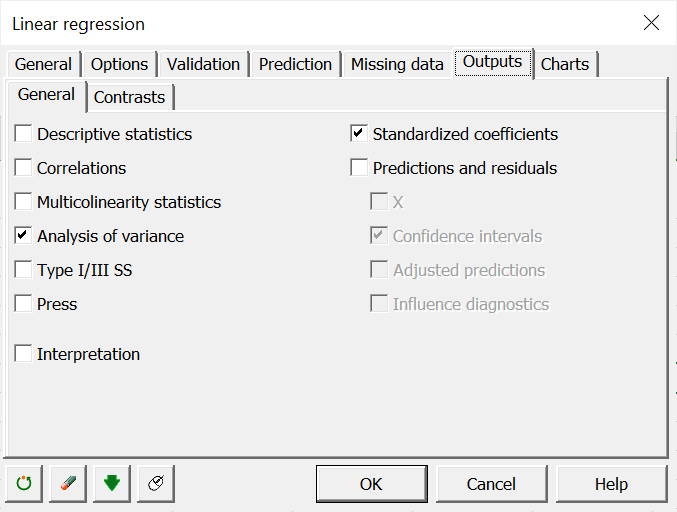
Go to the Outputs tab and only select "Analysis of variance" and "Standardized coefficients".
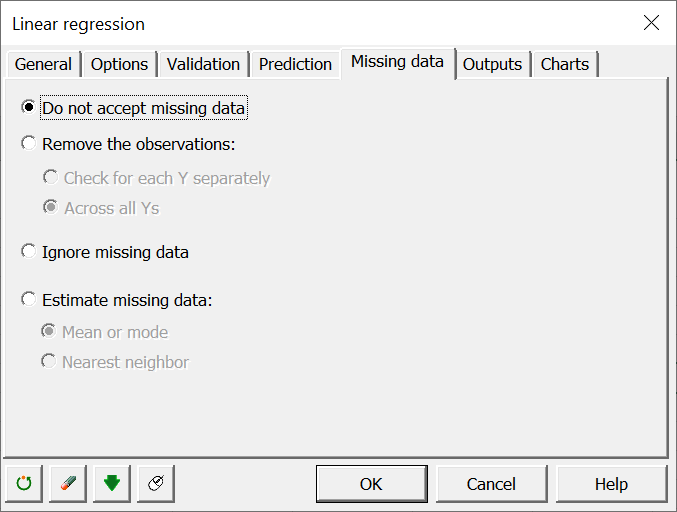
In Missing data, select "Do not accept missing data".
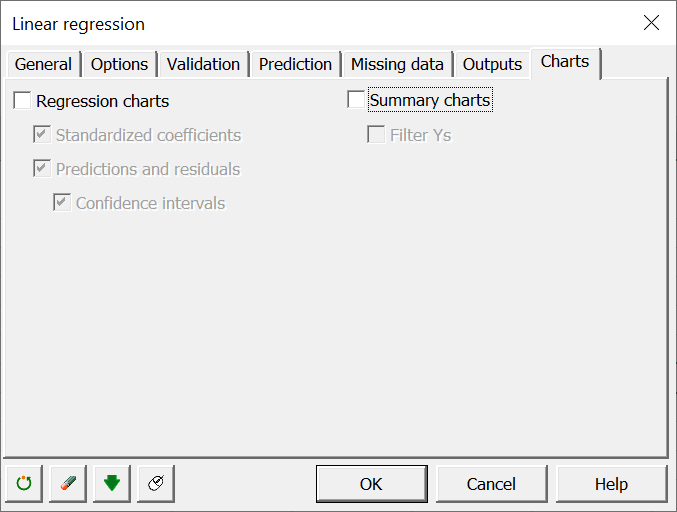
In the Chats tab and unselect the charts. Leave the boxes empty.
Finally, click on OK to begin computation.
Interpreting the results of the multiple linear regression
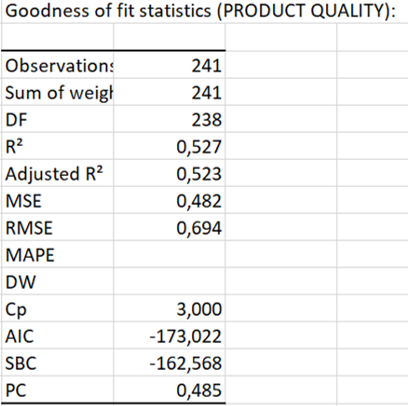
The table Goodness of fit statistics displays the goodness of fit coefficients of the model. The R² (coefficient of determination) indicates the % of variability of the dependent variable, which is explained by the independent variables. The closer to 1 the R², the better the fit.
In this particular case, 52.7 % of product quality variability is explained by environmental friendliness and perceived healthfulness. The remainder of the variability is due to other independent variables not included in this model. These effects could be perceived ethicality, brand image, green trust, age, etc.
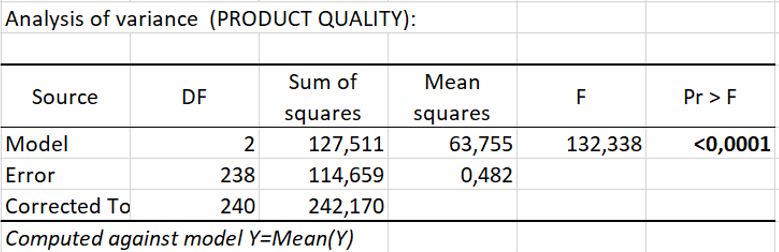
The results in the table Analysis of variance enable us to determine whether or not the independent variables (environmental friendliness and perceived healthfulness) bring significant information to the model.
The Fisher's F test is used. Given that the probability corresponding to the F value is lower than 0.0001, we would be taking a lower than 0.01% risk in assuming that the two independent variables do not affect product quality is wrong.
Therefore, we can conclude with confidence that the two variables bring a significant amount of information in explaining product quality.
The table Standardized coefficients correspond to the standardized regression coefficients (sometimes referred to as beta coefficients). These coefficients allow to directly compare the relative influence of the independent variables on the dependent variable and their significance.
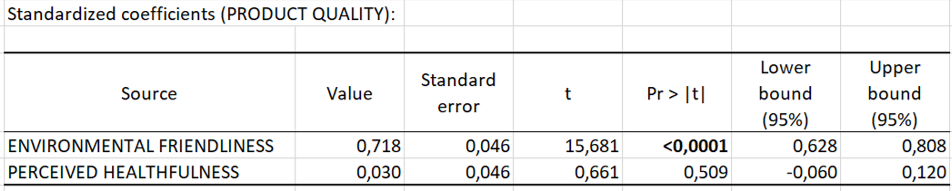
We can see that p-value is < 0.0001 for environmental friendliness and the p-value is > 0.05 for perceived healthfulness (0.509). Therefore, environmental friendliness significantly influences product quality, and perceived healthfulness does not exert a significant effect on product quality.
Because the coefficient (in the column "value") is positive, thus environmental friendliness increases (or positively influences) product quality.
Reporting the results of the multiple linear regression
Multiple linear regression tested whether environmental friendliness and perceived healthfulness significantly predicted product quality. The overall regression explains 52.7% of the variance in the model (p < 0.001). The results reveal that environmental friendliness positively influences product quality (β = 0.72, p < 0.001). However, perceived healthfulness do not significantly predict product quality (β = 0.03, p = .51).
Setting up a simple linear regression
Again, open XLSTAT and select Modeling data > Linear Regression.
Select the data on the Excel sheet. In the General tab, select the Purchase intention variable (column D) in the dependent variable field and Product quality variable (column C) as the independent variable in the "Quantitative explanatory variable".
Since the column title for the variables is already selected, leave the "Variable labels" option activated.
In Missing data, Outputs and Charts, you can proceed the same way as in the multiple linear regression and select the same boxes.
Click on OK to run the computation.
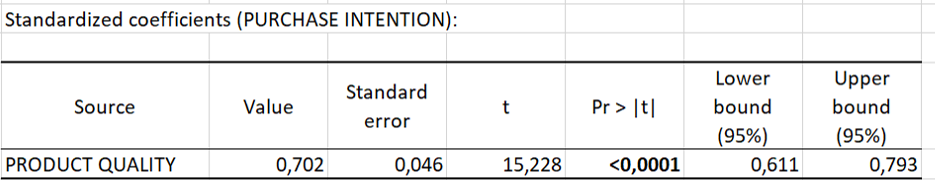
Reporting the results of the simple linear regression
A simple linear regression revealed that product quality positively influences purchase intention (β = 0.70, p < 0.001).